Allinea DDT MPI debugger
We have the Allinea DDT debugger for MPI (and Cuda) code. This is a powerful tool for developing and debugging your MPI programs - see more information at their website (especially the tutorials).
- You must be logged into 'knot.cnsi.ucsb.edu' (the regular login node) using an X window type of connection
- Your code should be compiled and linked with debug ( add a '-g' to your compilation, e.g.
mpicc  -c -g cpip.c
mpicc -o cpip cpip.o -lm -g
To start it, type /sw/bin/ddt
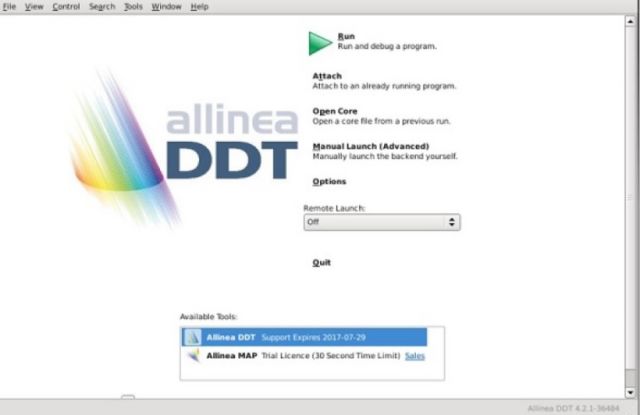
You will get a window like this,

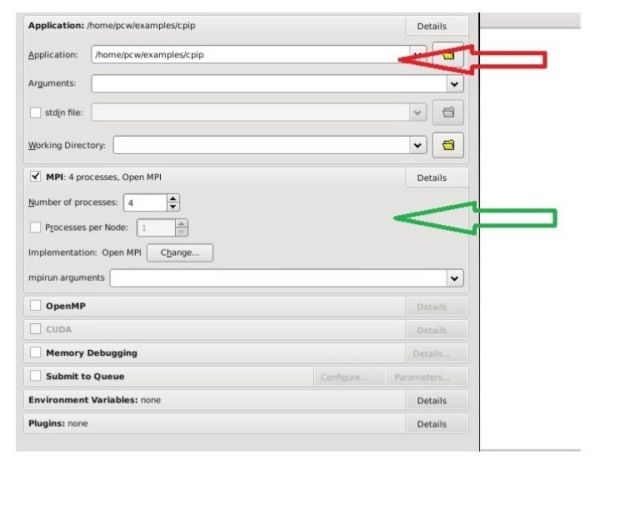
Click the 'Run' button, and you get a screen like this - where you put in (or browse to) the executable at the red arrow, and check off 'mpi' and set the number of processors at the green arrow

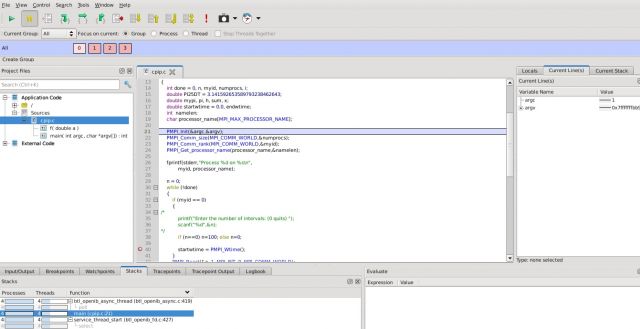
After you click 'run' you will get a debugging window such as this.

At this point you should consult the DDT documentation for how to debug your code
Note that you can also debug GPU/Cuda code with DDT - more detailed information on that is here.